Research
Market beliefs, tested on point-in-time data.
 Data study
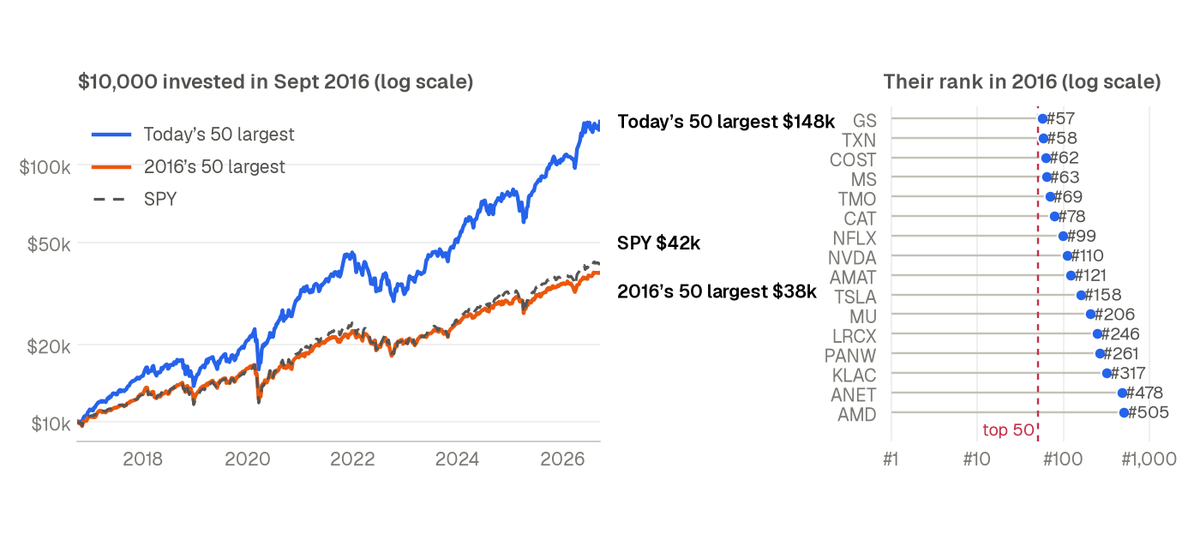
Backtest on today’s biggest stocks and you double your return
Holding today’s 50 largest US companies since 2016 returned 31% a year. The 50 that were actually largest in 2016 returned 14%, a little less than SPY.
 Market fact
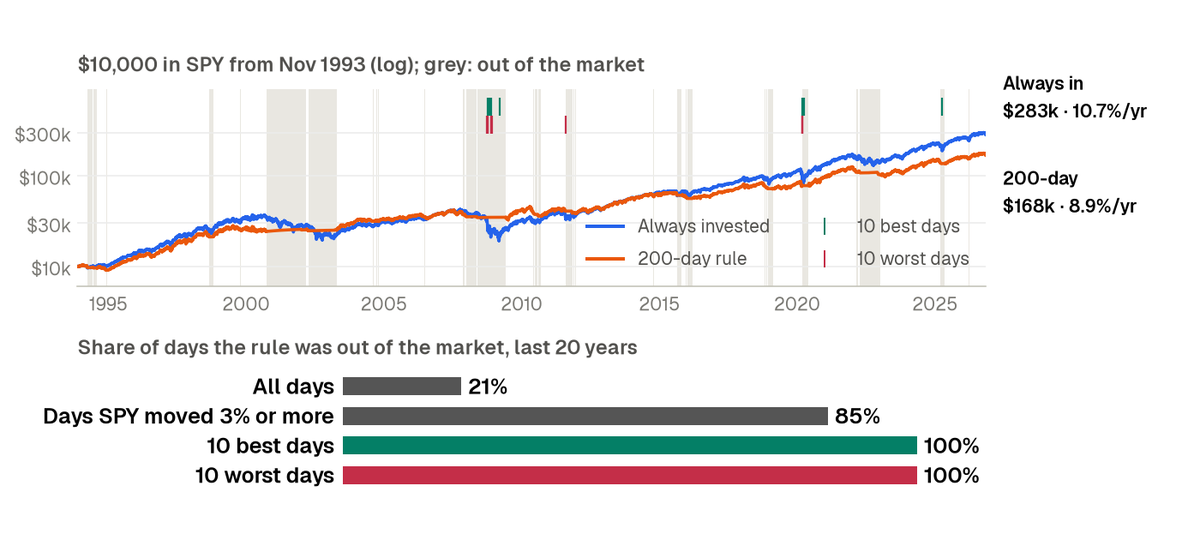
The 200-day rule sat out all 10 best and all 10 worst days of the last 20 years
Since 1993, holding SPY only above its 200-day average cut the worst fall from 55% to 23% and earned 8.9% a year against 10.7%. Almost all of its edge came from two bear markets.
 Data study
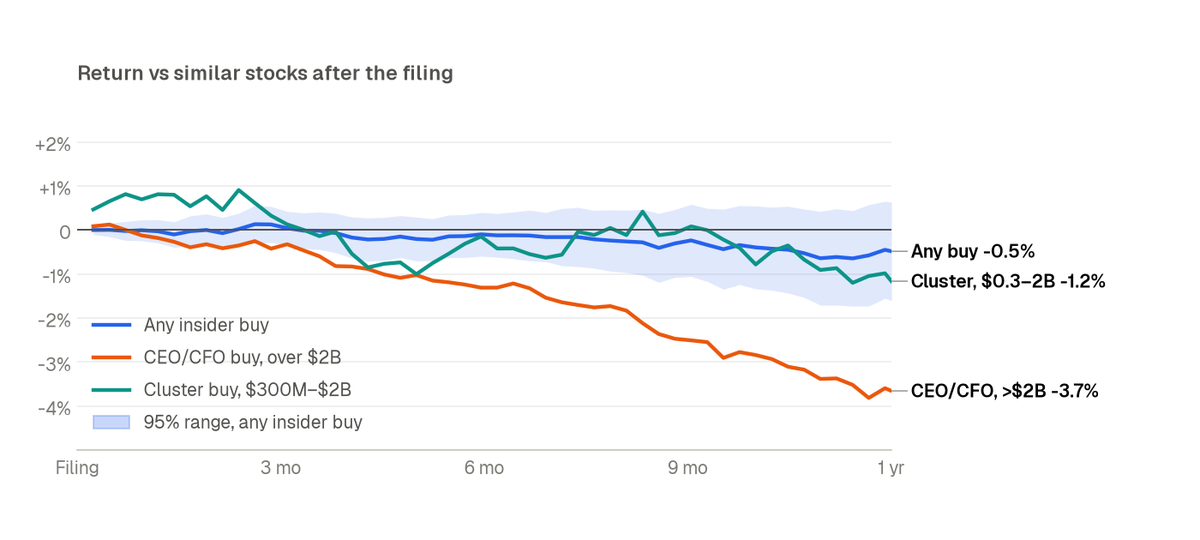
Insider buying, tested on 17,345 purchases: it didn’t beat similar stocks
Officers’ and directors’ open-market buys at US companies worth $300M or more trailed stocks of the same size and trend by 0.5% over the next year. Big-company CEO and CFO buys trailed by 3.7%.
 Data study
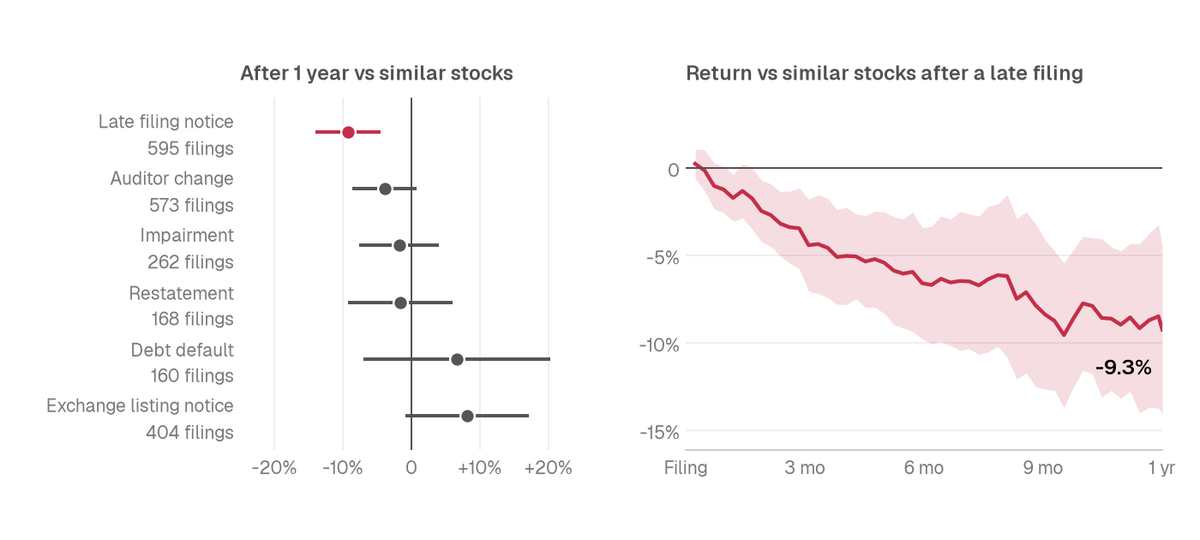
We tested six SEC red flags. Only one predicted returns: filing late
Companies that told the SEC their annual or quarterly report would be late trailed matched peers by 9.3% over the next year. Auditor changes, restatements, impairments, listing notices and defaults showed no reliable effect.
 Market fact
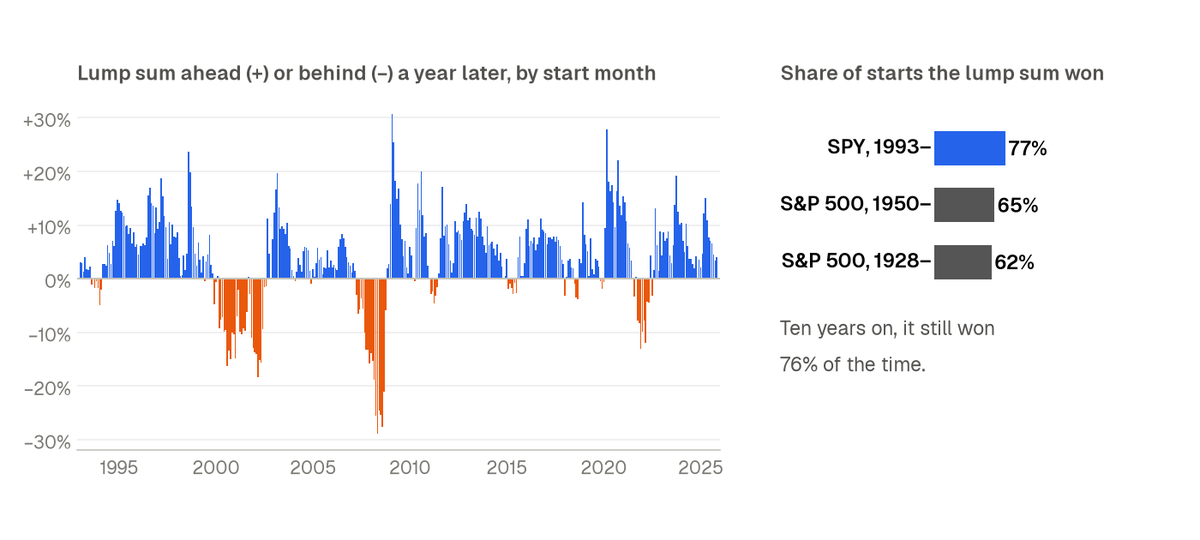
Investing all at once beat spreading it over a year 77% of the time
Since 1993, putting money into SPY in one go beat investing it in 12 monthly parts in 77% of start months, by a median 4.4% after a year. Spreading it out halved the worst first years.
 Market fact
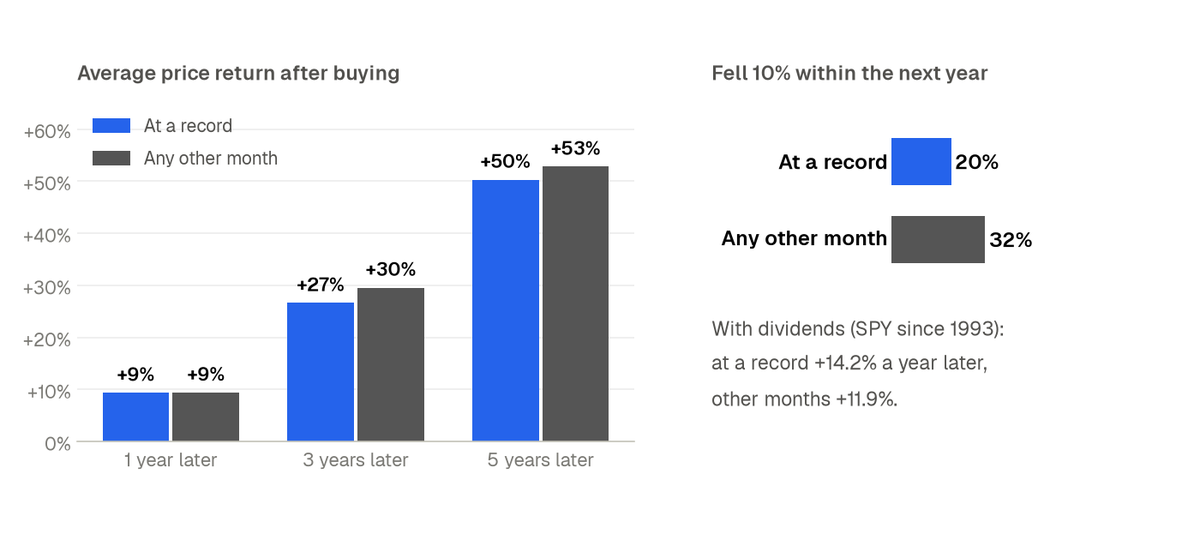
Buying at an all-time high did no worse than buying any other month
Since 1950, the S&P 500 rose 9.4% on average in the year after a month-end at a record, the same as after any other month. A 10% fall within the year was less likely from a record, not more.
 Market fact
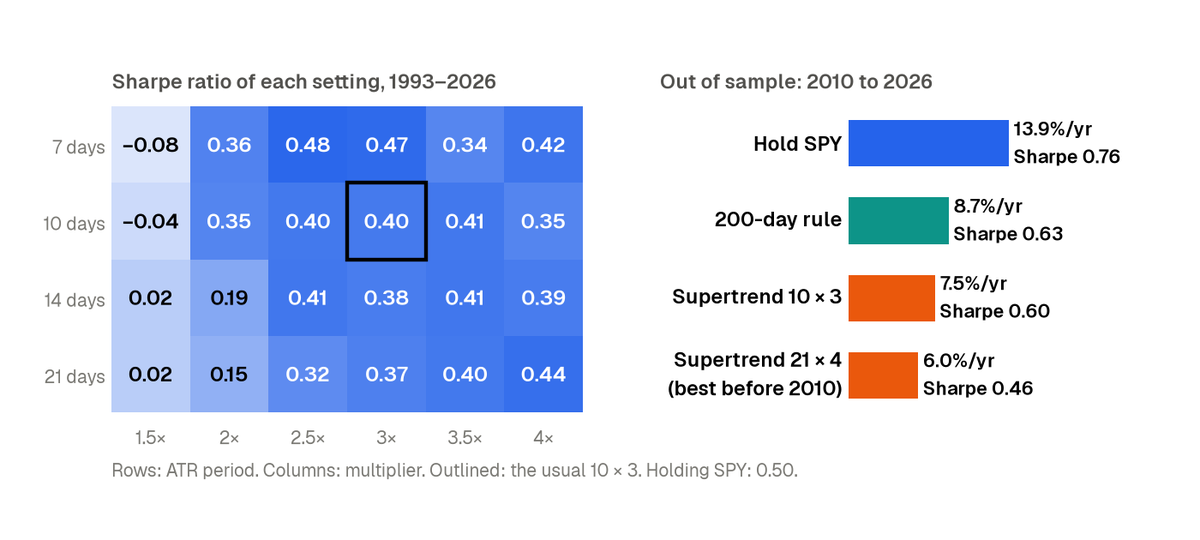
We tested 24 Supertrend settings. None beat holding the S&P 500
On SPY since 1993, every Supertrend setting had a lower Sharpe ratio than buying and holding. The setting that looked best before 2010 earned 6.0% a year afterwards, against 13.9% for holding.
 Market fact
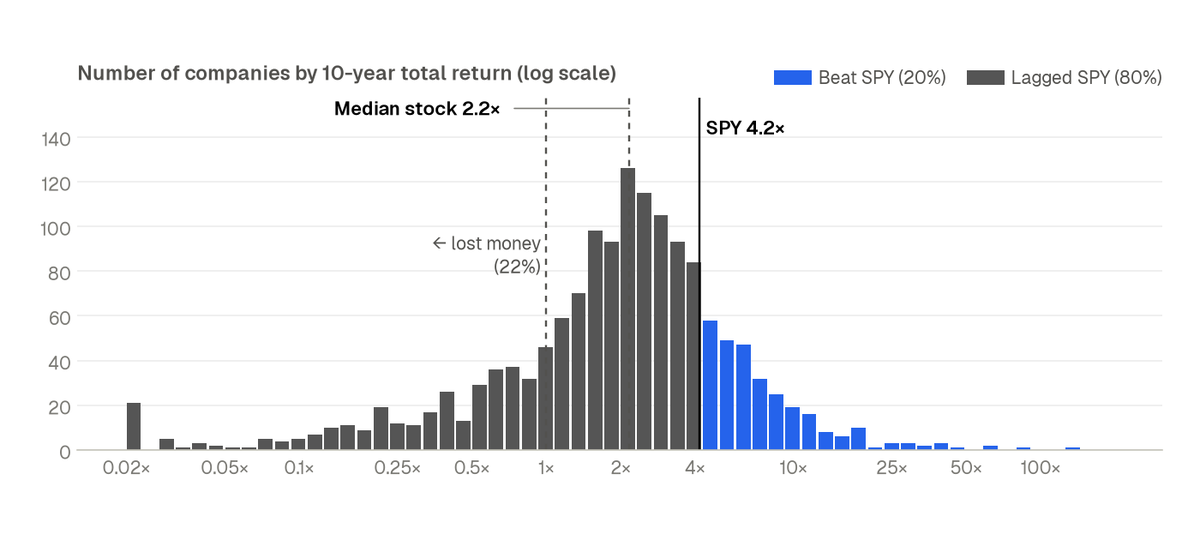
Only 20% of US stocks beat the S&P 500 over the last ten years
Of 1,493 US companies worth $300M or more in 2016, one in five beat SPY and more than one in five lost money. Ten companies made 44% of all the dollars the group created.
 Macro
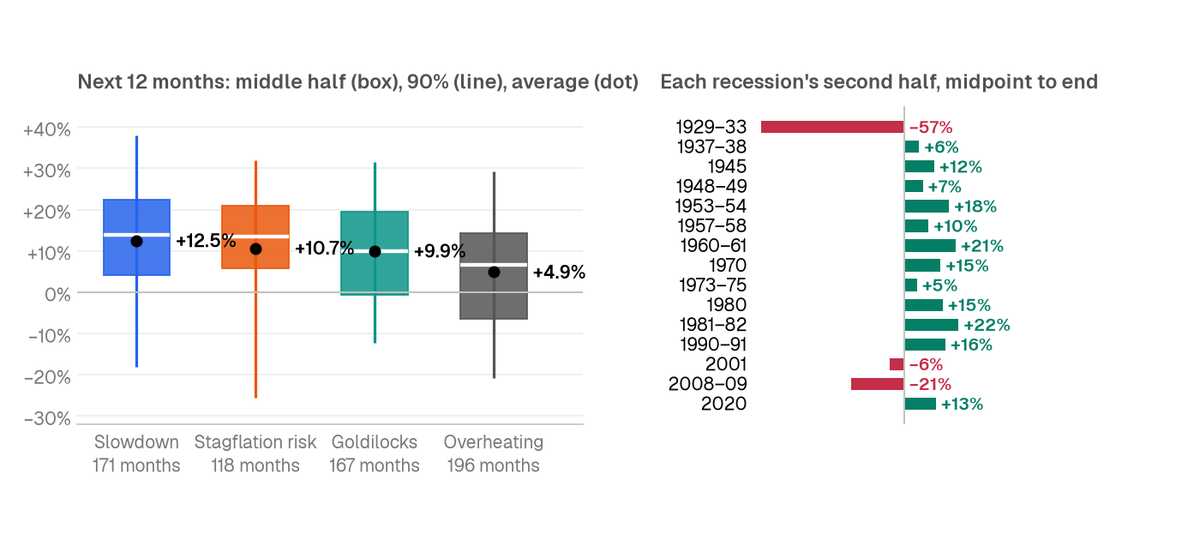
Stocks did best after the economy looked worst
Since 1967, the S&P 500 rose 12.5% on average in the 12 months after a Slowdown month and 4.9% after an Overheating one, by the regime known at the time. And the second half of a recession was up 12 times in 15.
 Market fact
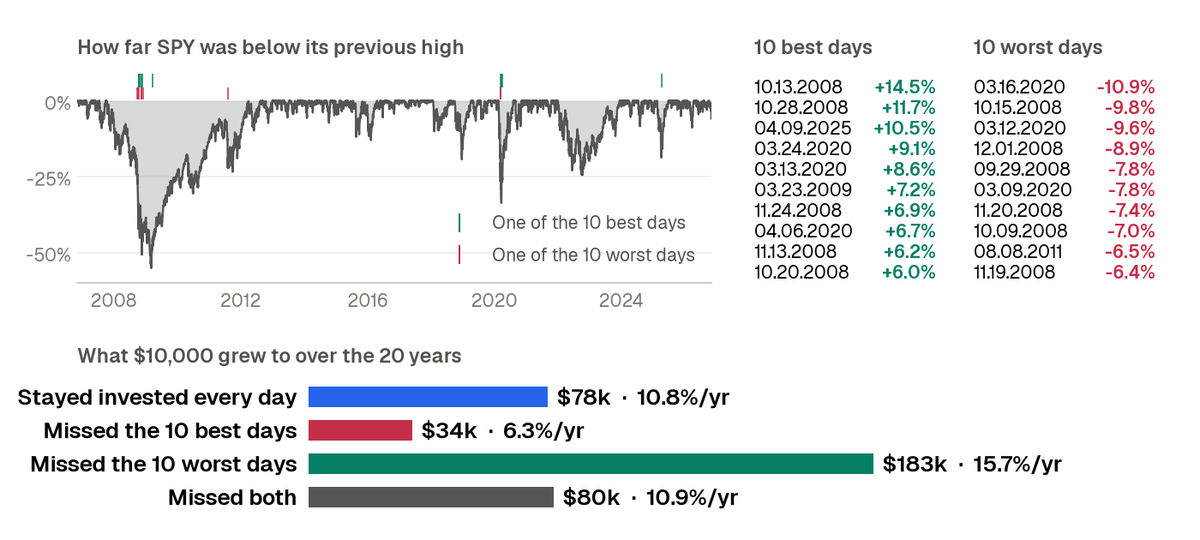
The 10 best days in 20 years came right next to the 10 worst
Missing SPY’s 10 best days in 20 years cut $78k to $34k. But 8 of those days came within a month of a top-10 worst day, so missing both left you about where you started.
 Market fact
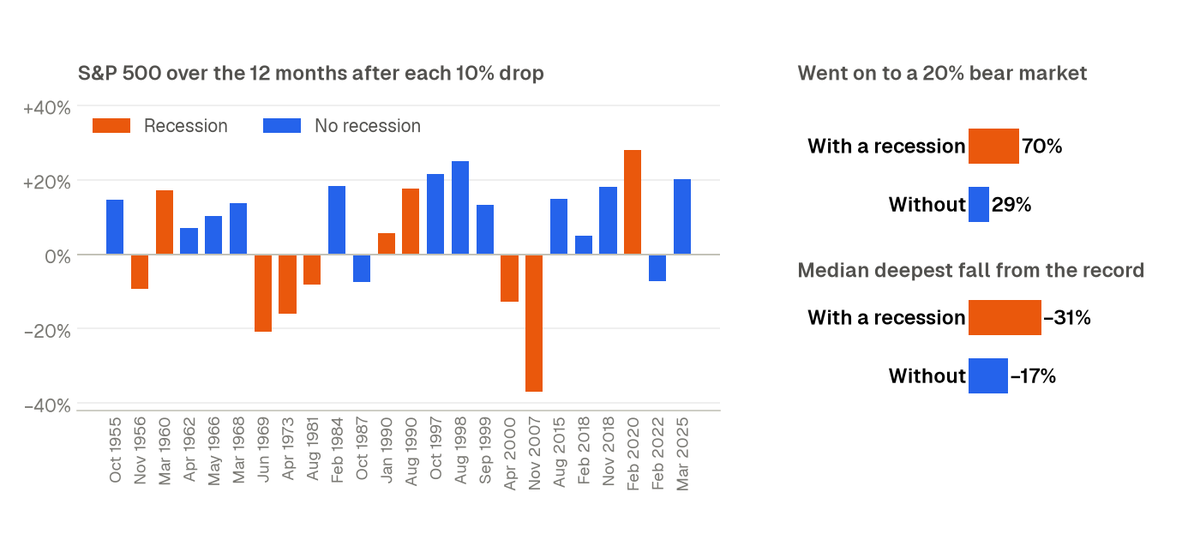
After a 10% drop, the next year was normal. Unless a recession followed
In 24 corrections since 1950, the S&P 500’s median return over the next 12 months was 11.8%, about the same as from any month. With a recession, 7 in 10 became bear markets; without one, 3 in 10.
 Macro
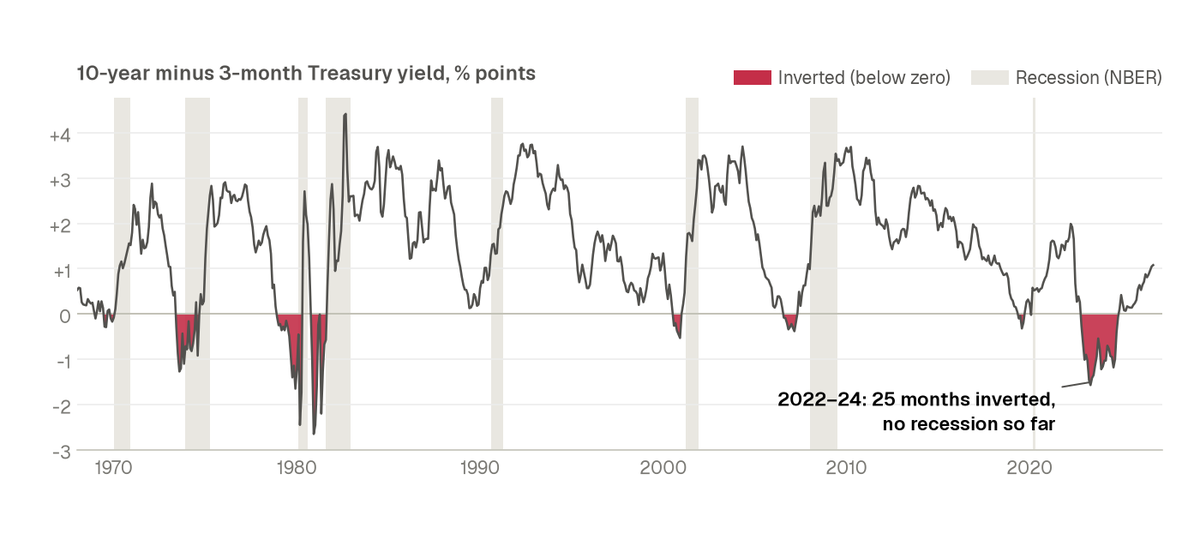
Every yield-curve inversion since 1969 was followed by a recession. Except this one
The 10-year minus 3-month Treasury spread went below zero 9 times from 1969 to 2020, and a recession began within 17 months each time. The 2022–24 inversion was the longest; 47 months after it began, no recession.
 Market fact
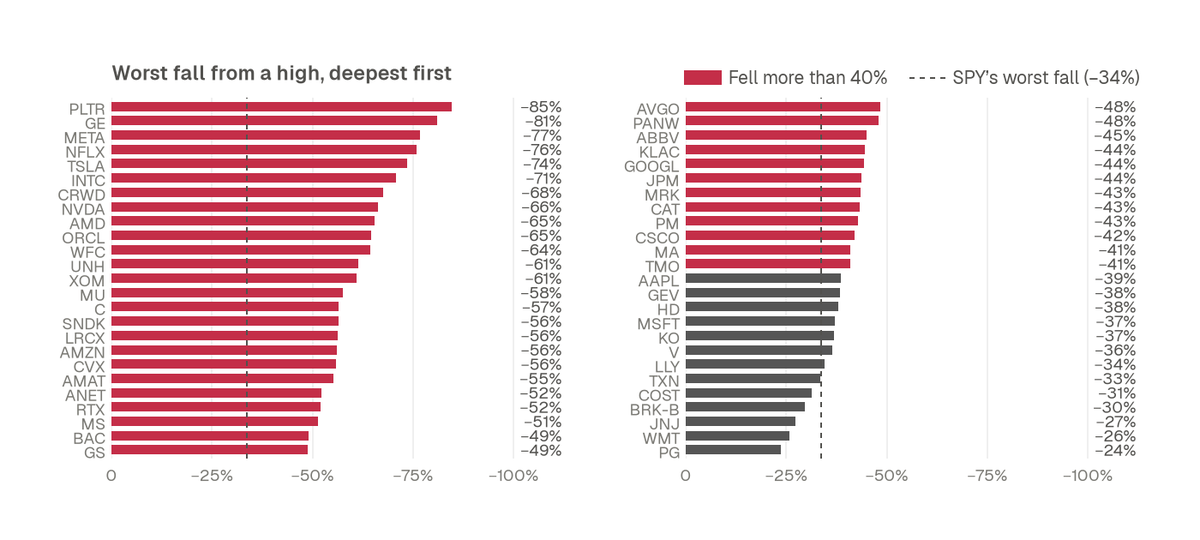
37 of America’s 50 biggest companies fell more than 40% on the way up
Of today’s 50 largest US companies, 37 fell more than 40% from a high at some point since 2016, and 23 more than half. SPY’s worst fall was 34%.
 Market fact
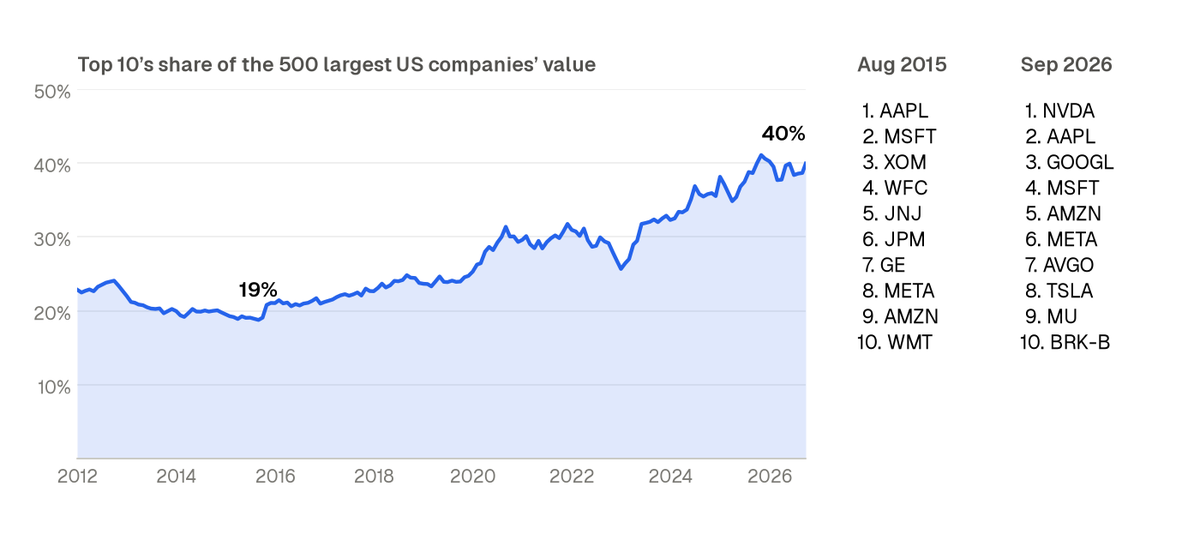
The 10 biggest US companies are now 40% of the 500 biggest
The top 10’s share of the 500 largest US companies’ value doubled in eleven years, from 19% in 2015 to 40% today.
 Market fact
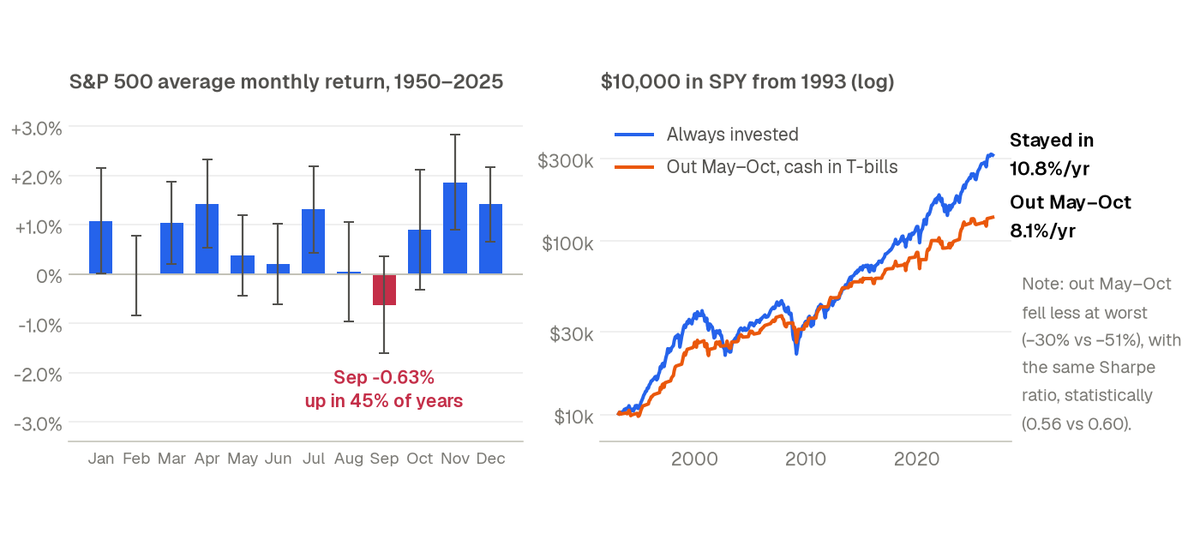
“Sell in May” cut risk and return by about the same amount
Since 1993, stepping out of SPY every May cut its worst fall from 51% to 30%, but earned 8.1% a year instead of 10.8%. Return per unit of risk was statistically the same.


Historical analysis for information only. Past performance does not guarantee future results. Not investment advice.